The discussion below provides a number of illustrations of how to analyse aspects of risk and uncertainty in a quantitative sense. This involves a mix of analytical strategies. Which strategy is most appropriate to a particular project depends on how much information is available.
10.3.1 The break-even carbon price for soil carbon sequestration when accounting for nutrient costs
From Tables 8.5 and 9.3, it is evident that (in terms of annualised costs) none of the soil carbon options canvassed by recent research will generate a net return for the ACCU prices assumed. For example:
-
under conservation tillage, the nitrogen cost is $19.60/ha/year
-
revenues from the carbon sequestered in the soil range from $5.50-$13.80/ha/year (assuming ACCU prices ranging from $10 to $25).
This information can be used to assist when conducting a price break-even analysis of an illustrative soil carbon project.
Because the analysis on which these estimates are based* assumes that additional nitrogen is required to fix carbon in the soil, the relationship between the benefits and costs of the project is an inevitable consequence of the relationship between the price of nitrogen (in the form of urea, which is around 46% nitrogen) and the ACCU price.
This can be shown as follows:
(1) revenue = (sequestration) × (ACCU price)
(2) (nitrogen required) = (sequestration/3.667) × 0.1 (This is to convert CO2 to carbon and then establish the required carbon to nitrogen ratio of 10:1.)
(3) (cost of nitrogen) = (nitrogen required) × (cost of urea) ÷ 0.46 (This is to relate nitrogen to urea.) The ratio of revenue to cost is the right-hand side of equation 1, divided by the result of equation 3, after equation 2 has been substituted into equation 3. The result is:
(4) (revenue to cost ratio for the soil carbon project) = (ACCU price × 3.667 × 10) ÷ (cost of nitrogen).
Note than in equation 4 the amount of sequestration cancels out; it appears in both the numerator and the denominator. What is relevant is the relationship between the cost of nitrogen and the ACCU price. This is an important short cut: if soil carbon sequestration requires the addition of nitrogen to maintain a particular ratio, then the amount of sequestration is not relevant. This particular uncertainty can be set aside when considering the variable cost break-even point.
The break-even point (at which cost equals benefits), where the ratio in equation 4 is 1, is:
(5) (break-even point) = (cost of nitrogen) ÷ (3.667 × 10)
Table 10.1 uses equation 5 to calculate the ACCU price required to break even for different assumptions about the required ratio of nitrogen to carbon and different urea prices.
With the preferred 10:1 ratio, and current prices of urea (A$400-500/tonne**), the ACCU price to break even (in the sense of covering variable nitrogen costs only) is between $24 and $30. This does not account for project set-up or sampling costs, so these prices are the minimum needed.
|
|
Table 10.1: ACCU prices needed to cover variable costs, accounting for nitrogen fixing costs, in soil carbon projects (A$) |
|
|||
|
|
Ratio of carbon to nitrogen |
Urea A$600/t |
Urea A$500/t |
Urea A$400/t |
|
|
|
15:1 |
24 |
20 |
16 |
|
|
|
10:1 |
36 |
30 |
24 |
|
|
|
5:1 |
71 |
59 |
47 |
|
Note: This break-even price refers only to variable nitrogen costs and does not account for project set-up and maintenance costs.
Source: CIE calculations.
These results imply that for soil carbon sequestration, ACCU revenues alone will not be sufficient to justify the project if the ACCU price is lower than $24 (if a carbon to nitrogen ratio of 10:1 is needed).
Of course, soil carbon projects could have benefits other than ACCU revenues alone. The relative importance of co-benefits is considered explicitly in the next section in a discussion of a generic plantation-based sequestration project.
This illustration shows the power of simplifying aspects of the problem. Without requiring estimates of sequestration (which are highly uncertain), the viability of a soil carbon project can be very quickly tested using known relationships. If the project proponent is not confident of receiving a price higher than $24 per ACCU, the project should not proceed (unless they are prepared to make a financial loss in order to potentially gain non-monetary co-benefits).
If the proponent is confident of a higher price, the analysis can be extended to include other variable costs (in particular, other nutrient costs) and other fixed costs as necessary.
10.3.2 Analysis of a generic environmental planting project
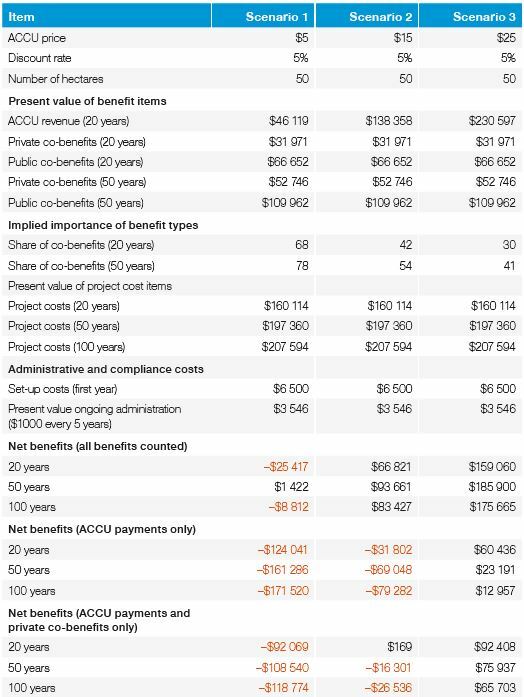
It is possible to combine the information in Table 8.2, Figure 8.4 and Table 9.2 to construct a simple, present-value model of a representative environmental planting sequestration project. The results below are generic, but show how relatively simple calculations can be used to understand the basic parameters of a business case without substantial cost.
Table 10.2 shows results under three scenarios for the ACCU price. Key features of the calculations are as follows:
-
The scenarios assume a 50-hectare project. The size of the project is an important consideration in overall returns, as the project needs to be large enough to cover its fixed costs. Break-even analysis involving project size is discussed further below.
-
The scenarios assume a real discount rate of 5%. This is effectively the minimum return required from the capital and other resources devoted to the project.
-
The scenarios assume that the opportunity cost of land is $75/hectare. This is illustrative, but is based on a land price of $1500/hectare and the same 5% real discount rate.
-
The scenarios assume sequestration rates for Kyogle, NSW (see Table 8.2).
-
ACCU revenue is calculated over a 20-year period. As noted above, this is purely illustrative. You can use the template for this model (available at Kondinin Group ) to simulate alternative periods for benefits.
Table 10.2: Results from a generic environmental planting project |
|
|
Note: This assumes sequestration rates as for Kyogle, NSW. The value of land is assumed to be $1500/ha, which at a 5% discount rate implies a $75/ha annual opportunity cost of land. All currency is in Australian dollars.
Source: CIE calculations using CIE / de Fegely farm forestry model.
The results vary for the different scenarios. For Scenario 1, the results indicate the following:
-
Assuming that revenue accrues over a 20-year period, the present value of ACCU revenue (given an assumed price of $5 per ACCU) is $46 119.
-
Over the same 20-year period, private co-benefits (assuming the accrual of all the private co-benefits as shown in Table 8.7) are $31 971, while public co-benefits (assuming the accrual of all public co-benefits as shown in Table 8.7) are $66 652.
-
While this model assumes that ACCU revenue accrues only over a 20-year period, the co-benefits could continue for as long as the plantation is in place. The table also shows the value of each type of co-benefit over 50 years. In discounted terms, the benefits over the longer period are just under double those for 20 years.
-
With a low ACCU price, co-benefits account for between 68% and 78% of total benefits. As the ACCU price increases (in Scenarios 2 and 3), the relative importance of co-benefits declines.
-
Over 20 years, the present value of project costs (not including administrative set-up or ongoing costs) is $160 114. Over 50 years (including ongoing maintenance costs), this increases to $197 360, while over 100 years (the sequestration maintenance requirement under the CFI) the cost increases to $207 594.
-
Compliance-related costs are estimated at $6500 initially (in the first year) and then $3546 in present value terms over the life of the project.
-
If all benefits are counted, over 20 years the project results in a net loss of $25 417. Over 50 years, there is a small net gain (because the co-benefits have longer to accrue), but over 100 years there is a small net loss. This is a consequence of ongoing maintenance costs.
-
If the project generates only ACCU payments (that is, if the co-benefits do not emerge), the project generates a net loss over any time frame.
-
Similarly, if only ACCU payments and private co-benefits emerge, the project generates a net loss over all time frames.
Scenarios 2 and 3 assume higher ACCU prices (all other factors are constant). The results show that for an ACCU price of $15, the project remains unviable if only ACCU benefits accrue, and remains unviable for most cases if only ACCU and private payments accrue.
With an ACCU price of $25, the project is viable for all combinations of benefits.
Break-even project size
Table 10.3 illustrates break-even analysis by showing the break-even project size (in hectares) for different assumptions about ACCU prices and the nature of benefits that accrue. In general, the larger a project, the more likely it is to break even, because it can cover fixed costs more easily.
For an ACCU price of $10, there is no minimum project size that breaks even unless all benefits accrue, in which case the minimum project size is 16 hectares. With higher ACCU prices, the required project size decreases. If ACCU prices reach $30, relatively small projects become viable. This sort of analysis is useful for farmers or landowners in considering whether they have enough land for a successful project.
|
|
Table 10.3: Break-even size for a 20-year project (hectares) |
|
||||
|
|
Benefits counted |
ACCU price A$10/t |
ACCU price A$15/t |
ACCU price A$20/t |
ACCU price A$30/t |
|
|
|
ACCU revenue only |
na |
na |
20 |
4 |
|
|
|
ACCU revenue and private co-benefits |
na |
50 |
9 |
3 |
|
|
|
ACCU revenue, private co-benefits and public co-benefits |
16 |
7 |
4 |
2 |
|
Note: ‘n.a.' indicates that the relevant measure can never break even.
Source: CIE calculations.
Break-even ACCU prices
Table 10.4 summarises break-even ACCU prices for a 50-hectare project over different periods. The break-even price ranges from $6 to $24, depending on the extent of benefits that accrue and the period covered.
Combined with views about likely ACCU prices, this sort of calculation allows farmers to consider whether a project is likely to succeed. For example, if only ACCU revenues accrue to a project, an ACCU price of around $20 is needed for the project to break even. Unless the farmer is confident about that price, the project would not be viable.
However, if the farmer is confident that co-benefits (of the assumed magnitude) will accrue, an ACCU price of around $5 may be sufficient for the project to break even. Any price above that will have a positive impact.
|
|
Table 10.4: Break-even ACCU prices for a 50-hectare project over various periods (A$) |
|
|||
|
|
Benefits counted |
20-year project |
50-year project |
100-year project |
|
|
|
ACCU revenue only |
18 |
22 |
24 |
|
|
|
ACCU revenue and private co-benefits |
15 |
17 |
18 |
|
|
|
ACCU revenue, private co-benefits and public co-benefits |
8 |
5 |
6 |
|
Source: CIE calculations.
The effect of loss of carbon during the life of the project
One of the risks in a sequestration project is the loss of carbon stores due to fire, disease or other factors. Under the ERF, lost carbon stores need to be replaced or paid for.
Assuming that the carbon stores are lost in Year 25 of the project (after all ACCU revenues have been paid), the present value today of re-establishing the project is around $20 000. In addition, there will be a loss of co-benefits, which are worth around $12 000 in present value. Thus, $32 000 is what is at stake from the loss of carbon stores.
The expected cost depends on the probability of the adverse event. Assuming a high value of 50%, the expected loss over the project life is $12 000 in present value terms. That amount needs to be subtracted from the net benefits in Table 10.2 to get a sense of risk-adjusted net benefits. In some cases, projects that appear viable without accounting for this risk will no longer appear so once risk is taken into account.
* Lam SK et al. (2013), ‘The potential for carbon sequestration in Australian agricultural soils is technically and economically limited', Table 2, Nature Scientific Reports, 3, article no. 2179
** See, for example, IndexMundi - Urea Monthly Price - Australian Dollar per Metric Ton
Explore the full Workshop Manual: The business case for carbon farming: improving your farm’s sustainability (January 2021)
Read the report
RESEARCH REPORTS
1. Introduction: background to the business case
This chapter lays out the basic background and groundwork of the manual
RESEARCH REPORTS
1.2 Being clear about the reasons for participating
Introduction: background to the business case
RESEARCH REPORTS
1.4 Working through the business case for carbon farming
Introduction: background to the business case
RESEARCH REPORTS
1.5 Factors determining project economics
Introduction: background to the business case
RESEARCH REPORTS
1.8 Important features of the business case
Introduction: background to the business case
RESEARCH REPORTS
2. How carbon is farmed under the ERF
This chapter considers in detail the activities that constitute carbon farming
RESEARCH REPORTS
2.5 Carbon farming under the Emissions Reduction Fund
How carbon is farmed under the ERF
RESEARCH REPORTS
3. The policy context and the price of ACCUs
This chapter takes a broad look at the policy context for carbon farming


